The Graph Control Buttons allow you to control most aspects of the graph view.
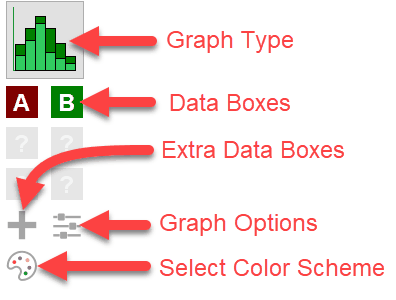
The graph type button allows you to change the graph type the tats tool will draw. The Data Boxes allow you to graph up to six different sets of data on your graph. Each box represents a data set.
As you add columns to your graph, they will fill the data boxes. The data boxes are colour coded to be the same as the data they represent.
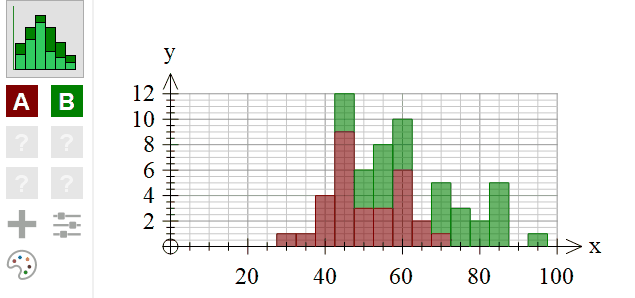
In this example, the first data box is graphing column A and is shown in red on the graph. The second data box is graphing column B and is shown in green.
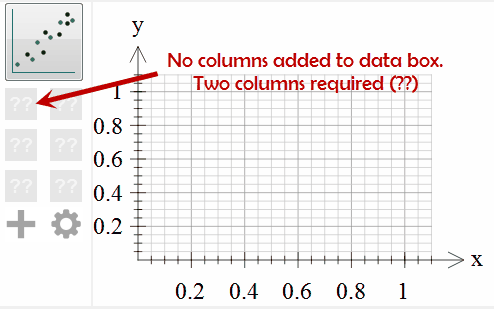
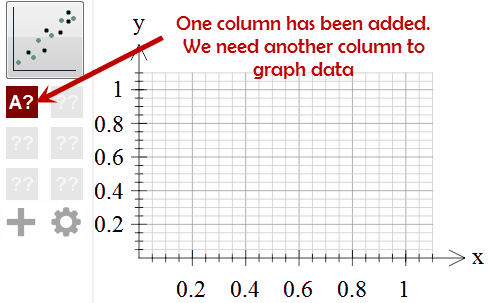
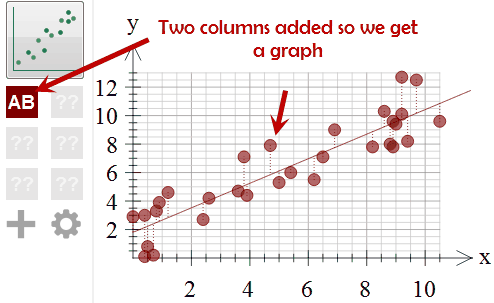
If you have selected a bivariate (or trivariate) graph type, you will need to add more than one column to each data box to create a graph. In the example below, we have added two columns (A and B) to the first data box in order to create a scatter graph.