Frequency columns are used to indicate frequency information for both data and group columns. They allow you to enter frequency tables and grouped data.
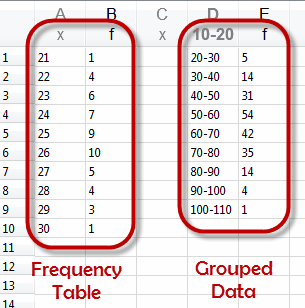
The stat tool correctly identifies the first set of data as having 50 elements and the second set 200. Statistics and graphs are generated utilising the frequency information.
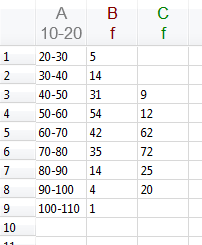
Group and data columns can have multiple frequency columns attached to them - each frequency column using the same groups/data.
You can enter your data directly into frequency tables or grouped data tables. Alternatively, frequency columns can be automatically generated from raw data when you use the FreqTable, CumFreqTable, Group, GroupW and GroupE functions in the data view.