The graph tool can graph integrals for any Cartesian function.
Integral Mode
Before using your mouse to create an integral, you must first enter Integral Mode. Push the ![]() button on the graph tool's toolbar.
button on the graph tool's toolbar.
Integral mode is only available if you have entered a function that the graph tool can integrate.
Once in Integral mode you can use the mouse to create integrals.
Integration with One Function Graphed
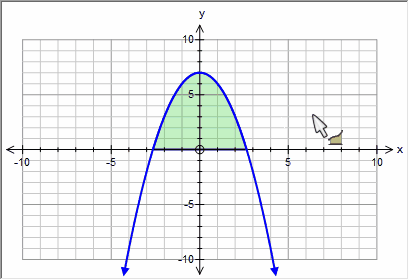
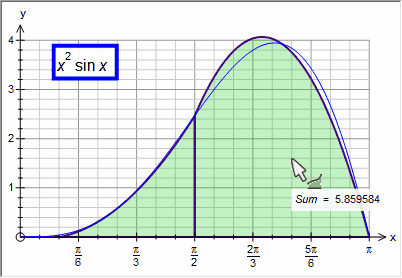
Sketching integrals is easiest when you only have one function graphed - because it is obvious which function you wish to integrate!
| • | Draw your function |
| • | Select Integral Mode |
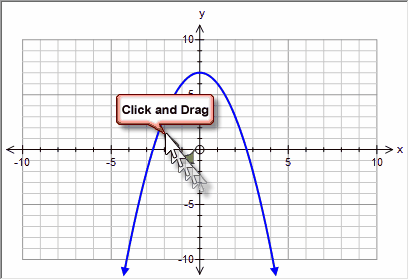
| • | Move the mouse to the lower bound you wish to integrate. |
| • | Click and drag the mouse to the upper bound you wish to integrate. |
| • | Release the mouse. |
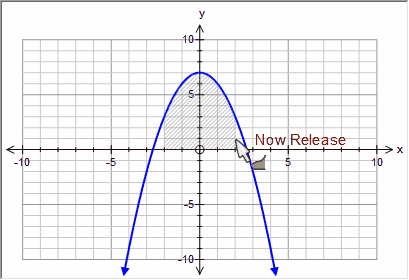
Easy!
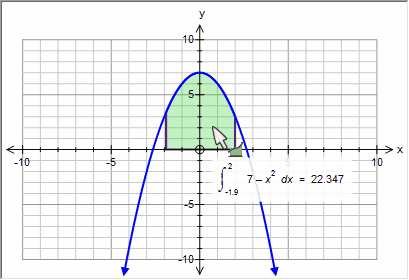
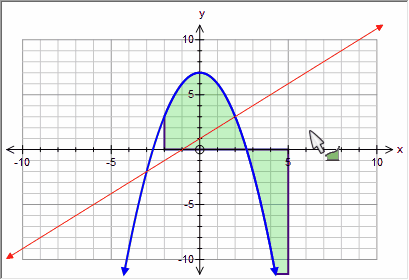
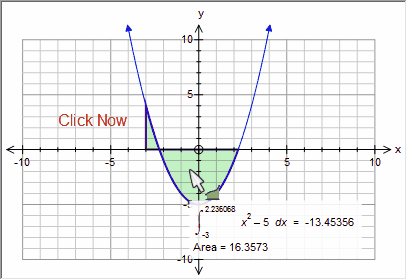
If you move the cursor over the integral and "hover", the graph tool will display the details of the integral.
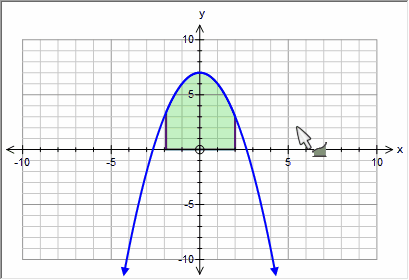
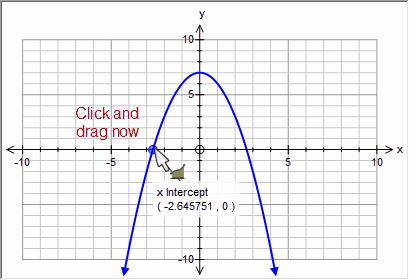
Often you will want to create an integral that starts or finishes at a special point - x intercepts for example. This is almost as easy - you just need to move the mouse near the x intercept and wait for the graph tool to find the intercept before you click or release the mouse.
![]()
Integration with Two (or More) Functions Graphed
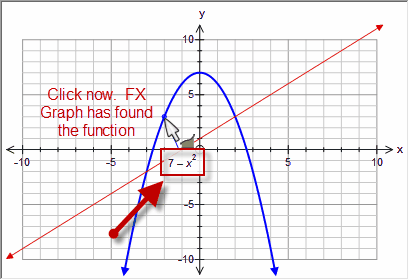
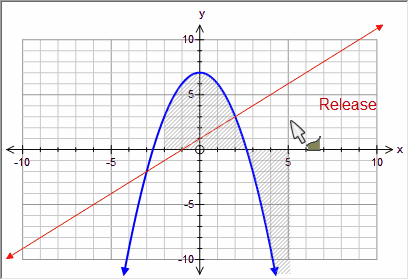
Integration with two or more functions graphed is slightly more difficult - simply because you need to tell the graph tool which of the functions you want to integrate. This is not too hard however. Move your cursor near the function at the lower bound and wait until the graph tool finds the function. Then click, drag, release - just like before.
Integration Between Two Curves
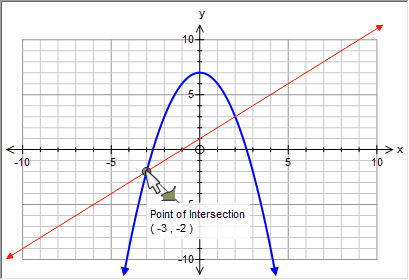
To create an integral between two curves using the mouse, your first click must be on an intersection between the two curves. This is normally exactly what you want.
Move until the point of intersection has been found
If you start your integral now, the integral will be between the two curves.
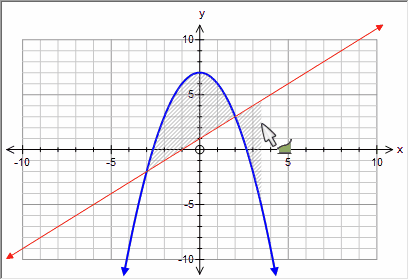
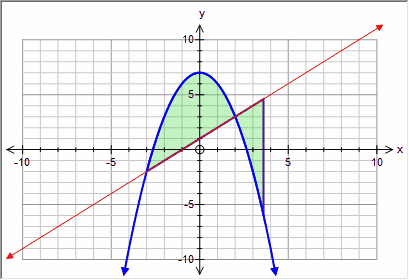
Notice that even though the integral had to start at an intersection, it does not have to end at one.
But I Don't Want My Integral to Start at the Intersection!
Then either create your integral with the mouse, starting at the intersection (or even under just one of the functions) and edit it later.
Integral to y Axis
You cannot create an integral (or area) to the y axis using the mouse. To create a y axis integral, you need to create it to the x axis using the mouse and edit the integral later.
Editing Integrals With A Mouse
You can edit some aspects of an integral using your mouse.
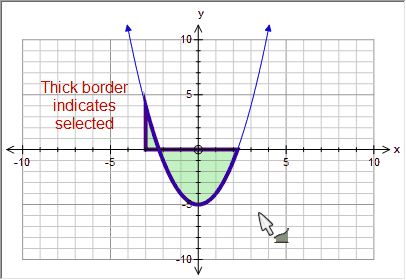
Selecting an Integral
Click anywhere within the integral to select it. When selected, the integrals border with thicken.
Deleting an Integral
When an integral is selected, press Delete to delete it.
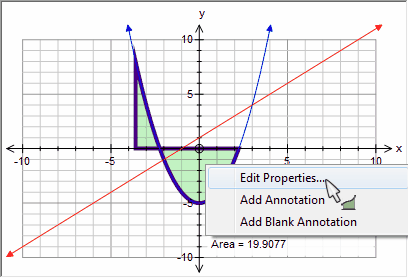
Editing Integrals
You can edit any integral by right clicking on it and then selecting Edit Properties.
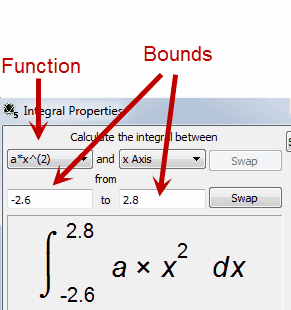
This allows you to select the function for which the integral is found and the upper and lower bounds of integration. Notice that the graph tool shows you a formatted integral so you can clearly see exactly what you are finding.
Bounds can be expressed in terms of pi or e and can contain constants.
Including a constant in your bounds of integration allows you to produce some very useful animations.
The Swap button will swap the bounds of integration which will reverse the sign of the result.
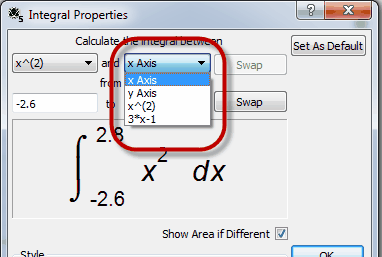
The second drop down box allows you to change how the integral is calculated. Here you can select an integral to the y axis or select a second function so that the graph tool finds the integral between two functions. This allows you to select any possible integral.
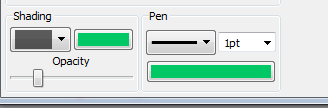
The bottom pane of the integral screen allows you to set the pen and shading for the selected integral.
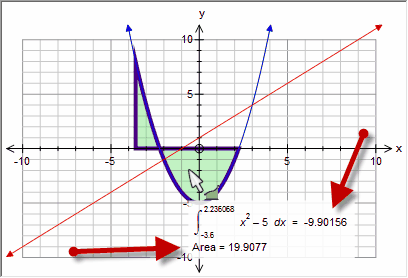
Show Area if Different
If this is selected, the graph tool will calculate and show the area of an integral as well as the actual integral.
Approximations To The Integral
The graph tool can produce seven different approximations to the integral.
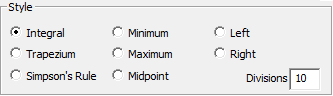
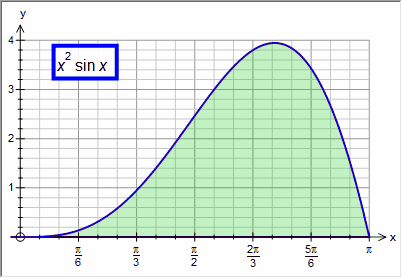
Original Integral
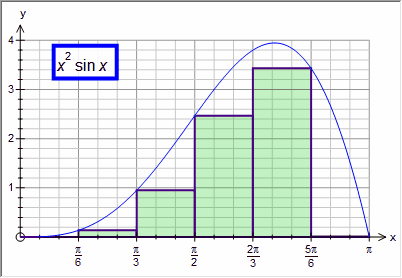
Minimum - uses the minimum in each division
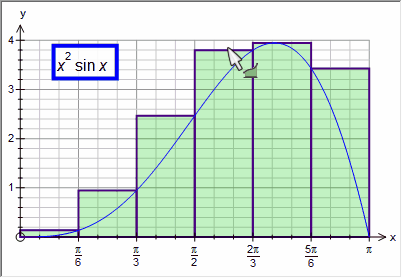
Maximum - uses the maximum in each division
Left - uses the left hand value of each division
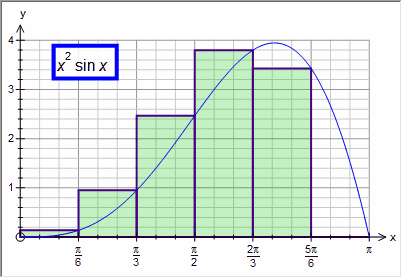
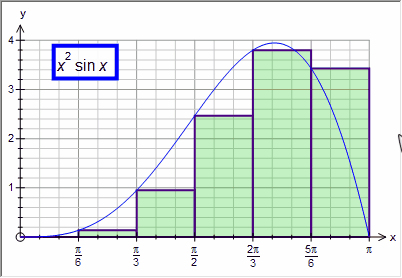
Right - uses the right hand value of each division
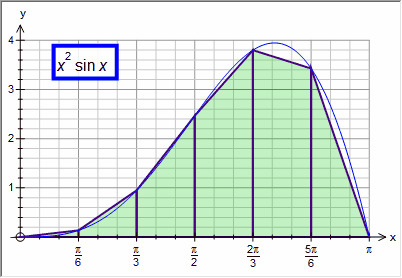
Trapezium Rule
Simpson's Rule (2 divisions)
Note that we had to reduce the number of divisions for Simpson's Rule otherwise the approximation was indistinguishable from the actual integral!
Each of the approximations divides the integral in to the given number of divisions (in most of the example above we have used 6 divisions). You can use a constant in the divisions box. This allows you to show students how quickly the various approximations approach the integral.
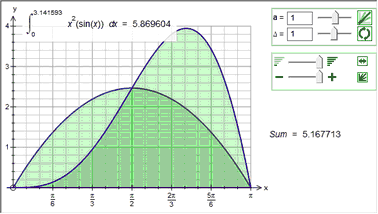
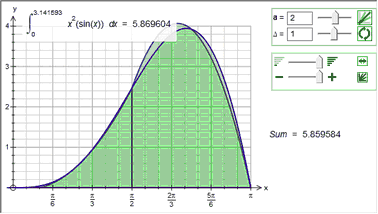
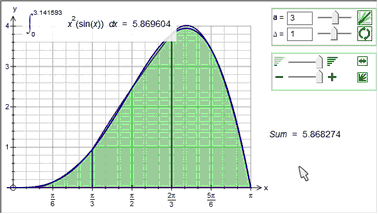
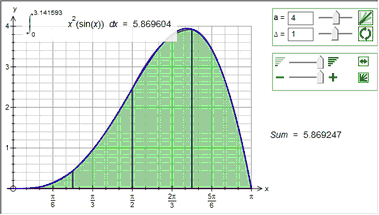
With just 4 divisions, Simpson's Rule approximates the integral to 3 decimal places.