Bar graphs have two options - the width of the bar and whether to show the data values.
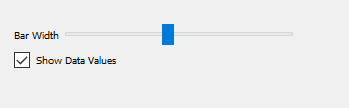
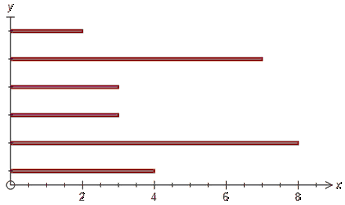
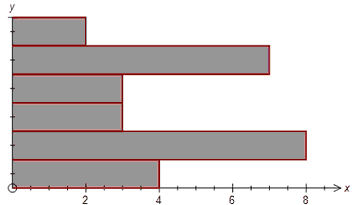
Moving the width slider will change the bars from very narrow, with a large gap, up to bars which touch each other.
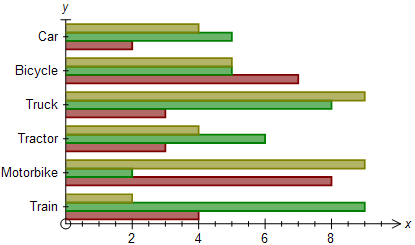
Plotting multiple data boxes on one set of axes will result in multiple bars per category. Bars within a category will not have a gap.
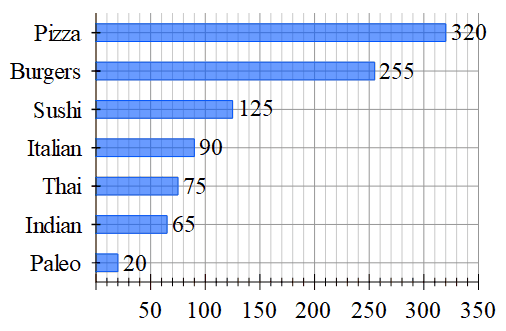
Bar graphs will automatically use any label column you have created.
Showing data values puts the length of the bar at the end of the bar.