FX Draw - How To Draw A Box Plot
FX Draw - How to Draw A Box Plot Using a 5-Point Summary
The two box plot types only differ in their orientation. All other options are equivalent.
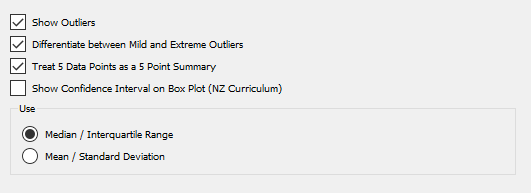
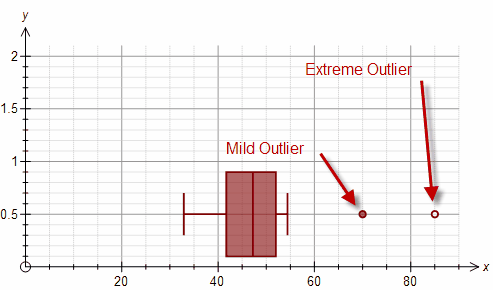
Outliers
You can choose whether to show outliers on the box plot. You can also choose whether or not to differentiate between extreme outliers and mild outliers. the stat tool uses the following definitions for outliers.
Outlier >1.5 Interquartile Ranges from the Median
Extreme Outlier > 3 Interquartile Ranges from the Median
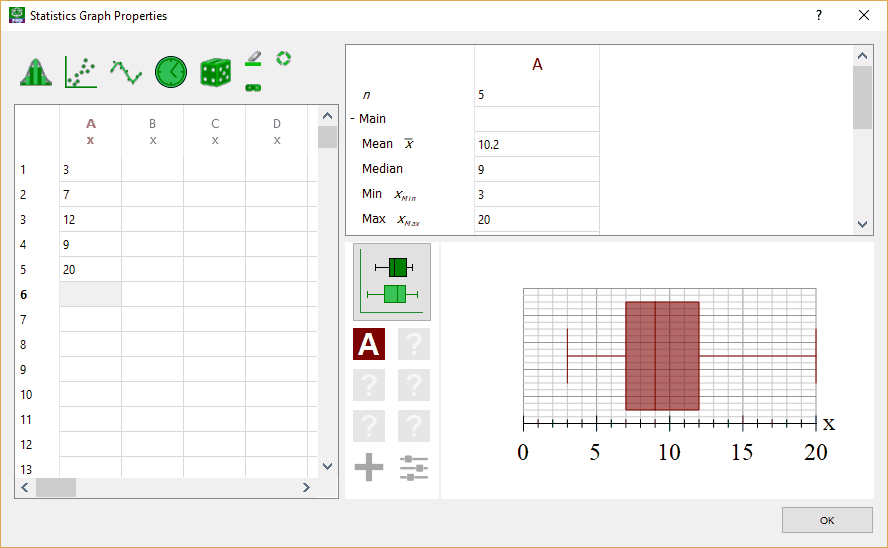
Graphing Using A 5-Point Summary
You can also tell the tool to treat five entered data points as a five-point summary as opposed to data. This allows you to quickly create a box plot to your exact specifications.
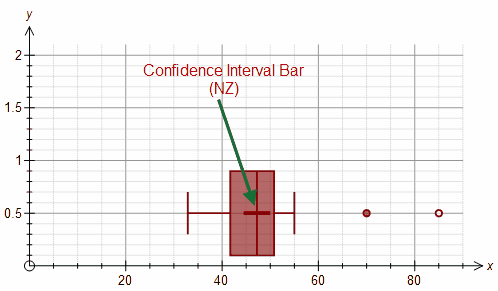
New Zealand Curriculum
You can also add an "informal" confidence interval bar to a box plot. This is a recent addition to the New Zealand curriculum. The confidence interval bar is drawn between
![]()