Many users will want to combine graph types on the same set of axes.
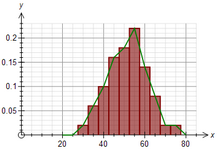
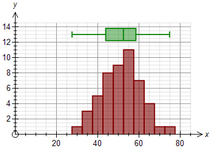
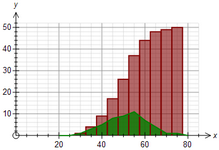
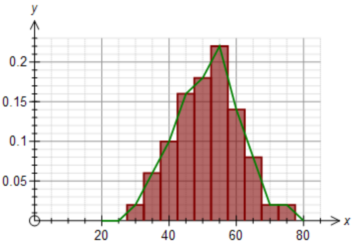
Frequency Polygon and Histogram Histogram and Box Plot Frequency Polygon and Cumulative Histogram
In all three examples, we have shown the same data in two different ways.
Before we look at how to achieve this, it is important to remember that not all graph types can be combined. More about this later.
Add Your Data Column to Two Data Boxes
Firstly, we add the data column to two data boxes using the standard commands. Your graph might look like this.
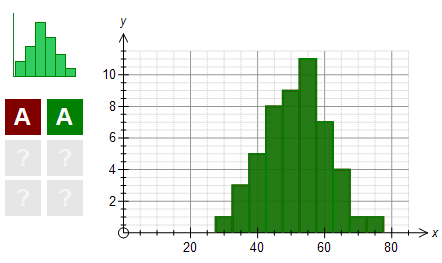
We have graphed column A in two boxes and the graph is two overlayed histograms. Not too useful yet!
Push the Second Data Box Button
Push the second data box button (the green one in this case) and the following screen will appear.
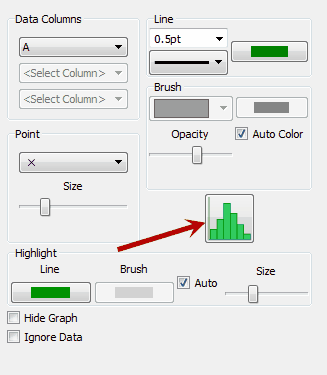
The graph type button is active which means that we can change the graph type for just this data box. For some types, this button will be greyed out which prevents you from overlaying another graph type.

Greyed Out - No Combining Available
Push the Graph Type Button
Push the graph type button and a list of available graph types will appear. Not all graph types will be available because not all graph types can be combined.
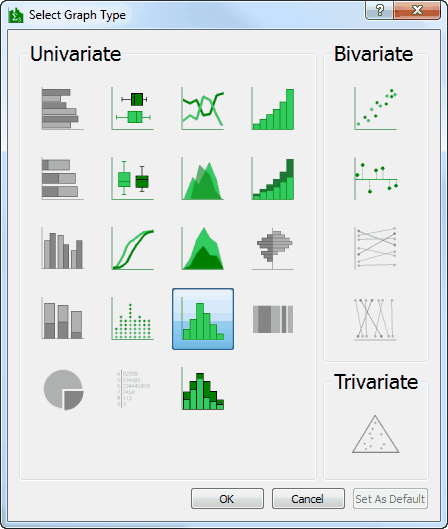
Change the Graph Type
Change the graph type to your desired graph type. In this example, we will choose the frequency polygon. You may also want to decrease the opacity of the brush at this point.
Finished!