
Video - Constants
Entering Constants
The graph tool understands eight constants.
Fixed Constants
e ~ 2.718281828
pi ~ 3.141592654
These constants can be used in functions, axes, domains, points and vectors.
Variable Constants
Variable constants (now there is an interesting concept - they probably should be called parameters) allow you to examine how changing numbers in a function affects the function's shape.
The graph tool reserves a, b, c, d, k and m as constants that can be included in functions. They are entered in the same way as the variables x, y, r, t and th.
For example, you can enter the following function
y = ax2 + bx + c
and examine how changing a, b and c affects the parabola.
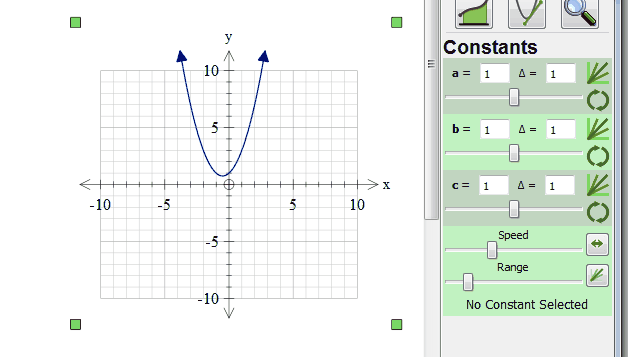
Changing Constants
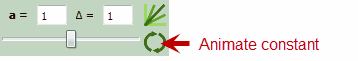
When the graph tool detects a constant in a function, it automatically adds a constant controller to the bottom of its screen. FX Graph adds one constant controller for each constant.
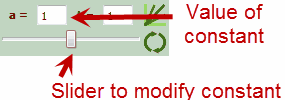
Let's look at a constant controller in more detail. The first edit box allows you to explicitly set the value of the constant. You can type in any value for the constant - including e or pi. For example, you can set the value of a to be pi/2. The slider allows you to modify the constant interactively. As you slide the slider left or right, the constant will be incremented or decremented by the amount shown as delta.
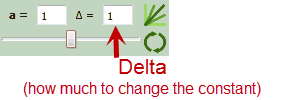
The second edit box allows you to set the Delta for the constant - how much it changes each time you move the slider (or draw a family of curves or animate). You can type any value in for delta - including values based on e or pi.
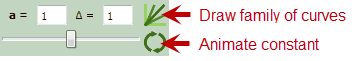
The final two buttons allow you to draw families of curves or animate a graph. These are discussed in the next sections.
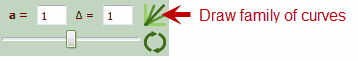
Families of Curves
The graph tool can graph a family of curves by changing a constant. Just push the button
For example, if you have entered the function y = ax2.
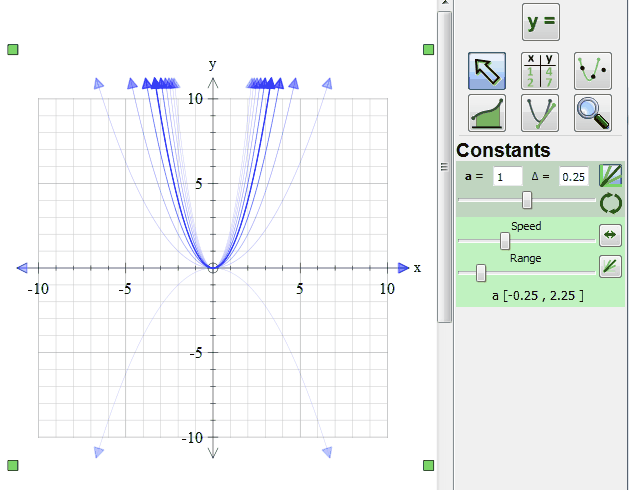
I have set a to be 1 and the delta to be 0.25. The graph shows a family of curves, centered around a = 1 with a varying from -0.25 to 2.25. In other words we have graphed:
y = -0.25x^2 y = 0x^2 y = 0.25x^2 y = 0.5x^2 y = 0.75x^2 y = 1x^2 y = 1.25x^2 y = 1.5x^2 y = 1.75x^2 y = 2x^2 and y = 2.25x^2
all on the same set of axes.
This graph also shows one of the graph tool 4's new features where graphs away from the "main" value of a have reduced transparency. This can more clearly demonstrate some concepts. This, in turn, brings us to the other window in the constant controllers.
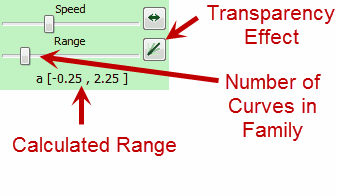
Two of controls in this window affect families of curves. The slider changes the number of curves in the family, or how many steps away from the "main" value the graph tool moves. By moving the slider all the way to the right, we greatly increase the number of curves in the family. Underneath the slider, the graph tool shows the range of values that a will take based on your current settings. In our case a is varying from -0.25 to 2.25.
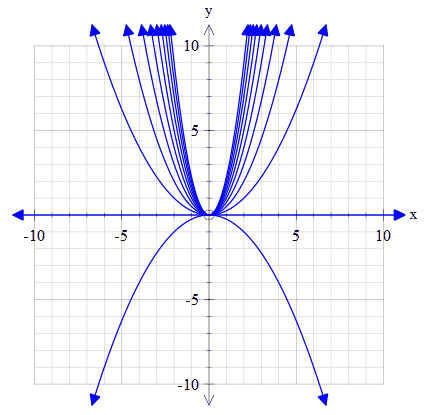
You can also turn off the transparency effect using the indicated button.
Animations
All constants can be animated. Just push the animate button on the constant you wish to animate.
The constant will immediately start animating. a will increase and decrease in steps of delta.
The second controller window allows you to control the animation.
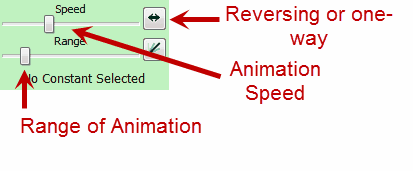
The Number of Iterations slider controls how far from the "main" value the graph tool travels in the iteration. The Animation Speed slider controls the speed of the animation. The Reversing/One-Way button controls whether the animation goes
Up ... Down ... Up ... Down ... Up ... Down ... Up
or
Up ... Start Again ... Up ... Start Again ... Up ... Start Again ... Up
Brain Drain
Animating functions in the graph tool is very computationally intensive because the graph tool has so much to calculate each time. Intercepts, maxima and minima, integrals, derivatives... everything is recalculated. This means that on slower computers, the animations may not be as fast as you would like.
Stopping an Animation
You can stop an animation by clicking on the animate button again.
Animation with Multiple Constants
If you have more than one constant, you can change the other constants during the animation. Try animating the c constant in y = ax2 + bx + c. While the animation is running, change a and b.
Constants Everywhere
You are not restricted to using constants just in function definitions. The can be used in most situations in the graph tool.
| • | In domains. |
| • | In the bounds of integrals. |
| • | In the number of divisions for integral approximations. |
| • | In the "At" point of tangent/secant lines |
| • | In the Delta of tangent/secant lines. |
Using constants in these locations allows you to easily create some fairly fancy animations and families of curves.