To create a graph, we need to add columns to the data boxes. There are a number of ways of doing this.

Video - Graphing Statistical Data
Quick Graph
Right click on the column we want to add and choose Quick Graph. The selected column will be added to the first available position in the data boxes. This is usually the quickest way to create graphs.
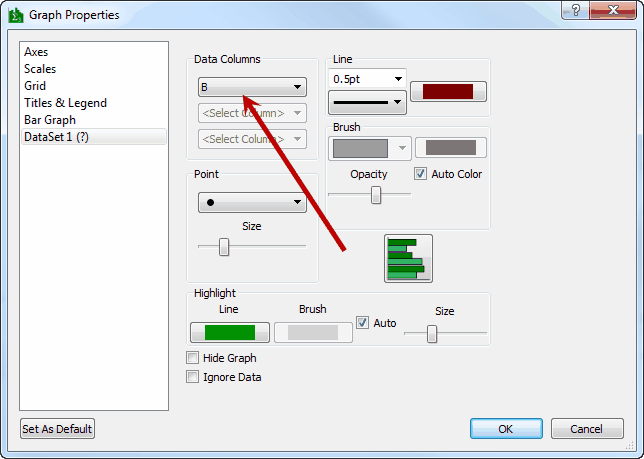
Data Box Button
If you push a data box button, you can change the properties of the data box - including which column is being graphed.