The stat tool can highlight data in columns.
You can highlight data in the Data View by selecting it and pushing the Highlight button (or typing Ctrl+B).
![]()
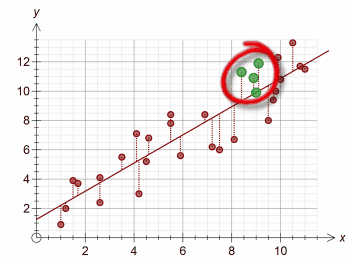
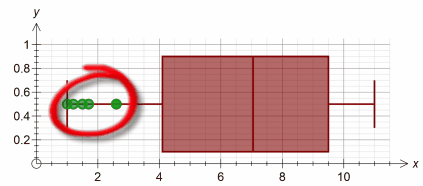
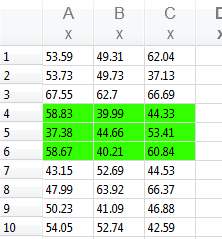
Highlighted data is green in the data view.
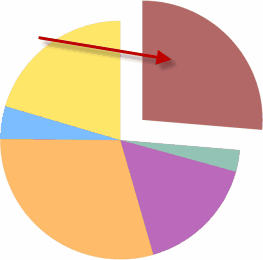
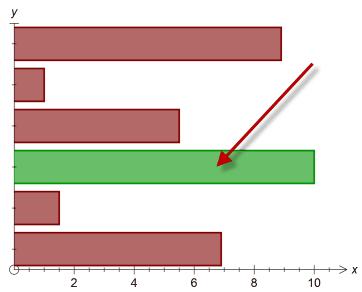
In most (but not all) cases, the highlighted data will also be highlighted on the graph. Each graph type has its own way of showing highlighted data.