
The stat tool's line graphs are very powerful and, therefore, have lots of properties available.
Normal Line Graphing
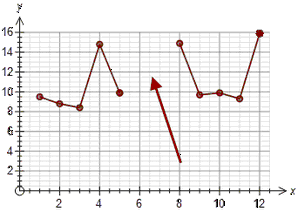
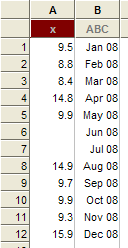
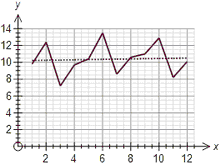
When graphing lines, the stat tool graphs the row number on the x axis and the data on the y axis.
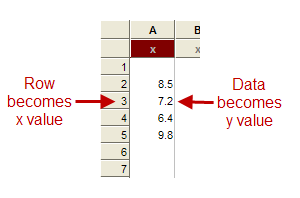
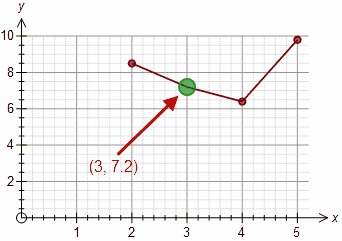
Notice that in the example, there is no data point for x = 1.
This behaviour is intuitive but it is necessary to understand it in order to make sense of some of the other options that the stat tool provides.
Fill Gaps in Data
If you give the stat tool the following data to graph, the stat tool needs to know what to do with the gap in the data.
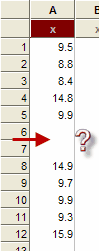
Basically, the stat tool has two options, either it can break the data into two separate bits or it can join up the data.
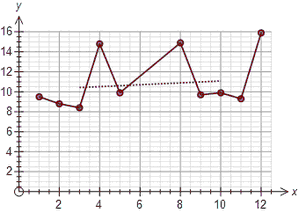
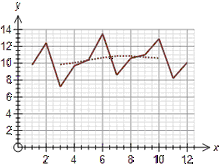
The Fill Gaps in Data option controls this behaviour. If you allow it to fill gaps in the data, the stat tool will also fill gaps in the smoothed version of the data. In this case, this allows the smoothed version to be drawn.
Show Lines
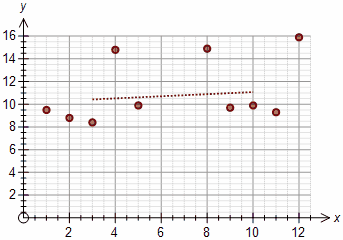
This option allows you to turn off the lines if you wish, making the line graph more like a scattergraph.
Show Data Points
The stat tool normally marks each data point with a dot. This option allows you to just draw the lines.
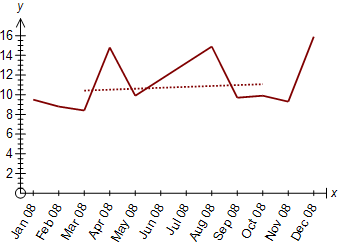
Use Labels for x Axis
If this option is turned on, the stat tool will automatically use any labels you have entered in your data.
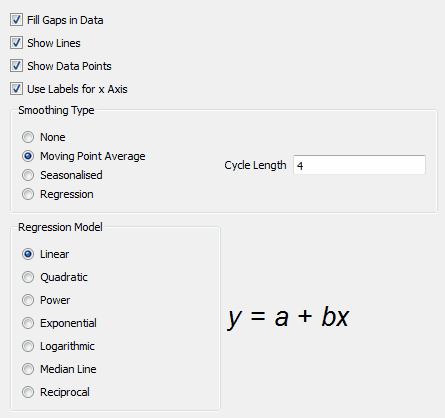
Smoothing Type
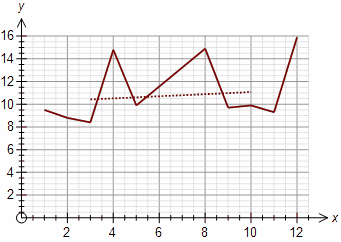
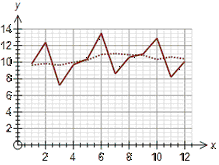
All of the example graphs above have had a dotted line added. This line is a smoothed version of the data. You can control what type of smoothing is used here. the stat tool can automatically add moving point average lines, (de)seasonalized data or a regression line. Alternatively you can turn the smoothed line off.
Moving Point Average Seasonalized Regression Line
The moving point average line cycle length is entered in this section and the moving point averages are automatically centred for even length cycles. The seasonalised data is dependent on settings in other sections of the stat tool. The regression line can be one of seven as discussed below.
Regression Model
The stat tool can calculate and use seven different regression models to fit data. The model used for the line graph is controlled here. the stat tool shows you a formatted version of the model's equation as you change the model.