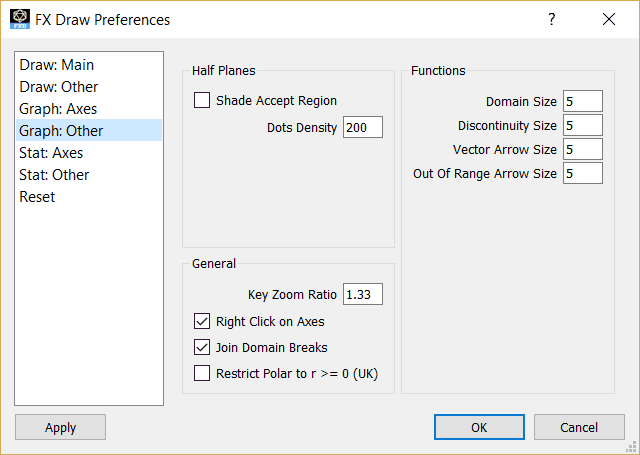
Shade Accept Region
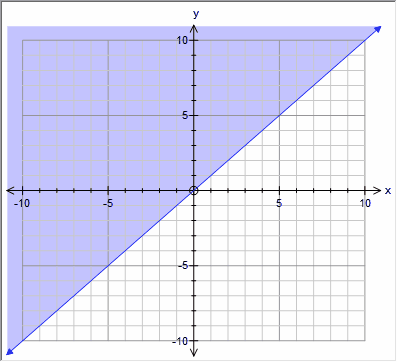
When shading the feasible region for an inequality, some locations shade the region that AGREES with or accepts the inequality.
y >= x
and some schools shade the region which disagrees with or does not accept the inequality
y >= x
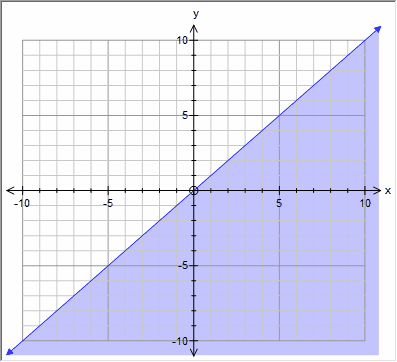
If you tick Shade Accept region, y >= x will produce the first graph.
Dot Density
For some complex graphs, the graph tool will shade feasible regions with an array of dots. The greater the number of dots, the more solid the shading - but the slower the calculations. A dot density of 200 (the default) will produce acceptable results on most computers but you can decrease the density on slower computers or increase it on faster computers.
Domain Size
Sets the size of the domain end points. The size is the radius of the circles - in millimetres.
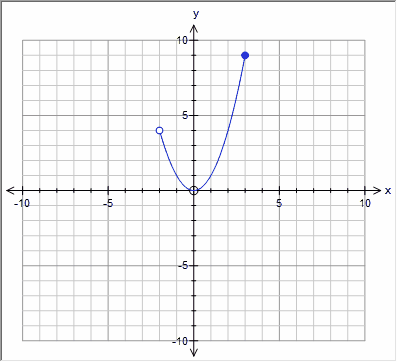
Discontinuity Size
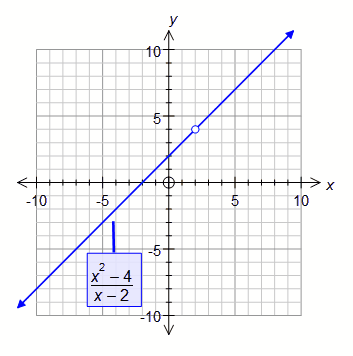
Some functions have point discontinuities (see example below). The graph tool automatically finds these point discontinuities for rational functions and displays them with a small circle. This preference controls the radius of the circle (in millimetres).
Key Zoom Ratio
Pushing the Page Up and Page Down buttons will zoom the axes in the graph tool. This number determines the ratio that the scale is increased or decreased by.
For example, the default Key Zoom Ratio is 1.33333. If you axes have maxima of 10 and minima of -10, pushing the Page Up button will change the maxima to 13.33333 and the minima to -13.33333.
Right Click On Axes
Usually, right-clicking in the the graph tool screen will start the Quick Entry screen but if you right click on an axis, the graph tool will start the Axes properties screen. Some people dislike this behaviour and find it distracting. You can turn it off here.
Join Domain Breaks
Some locations mark domain breaks with a dotted line. Other locations do not use a dotted lines to show domain breaks.
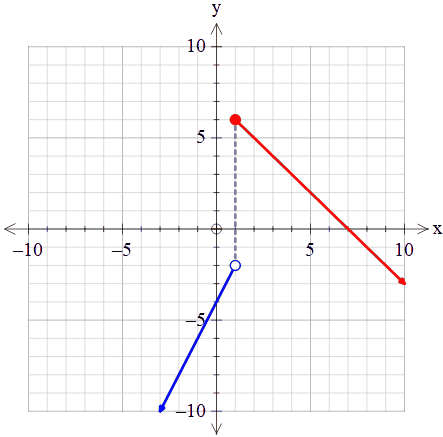
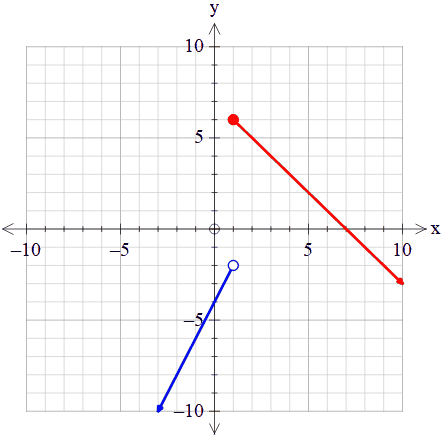
Join Domain Breaks ON Join Domain Breaks Off
Restrict Polar (UK Curriculum)
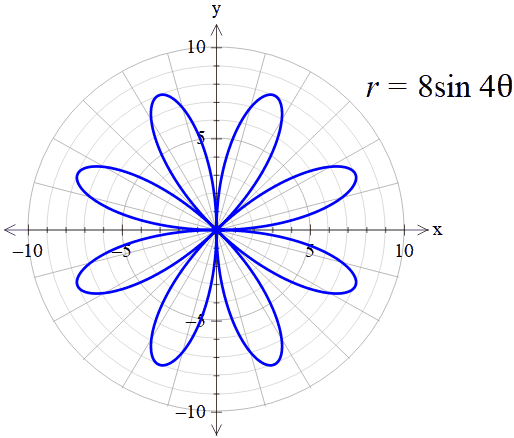
The UK curriculum requires teachers do restrict polar graphs to r > 0. You can force the graph tool to honour this here.
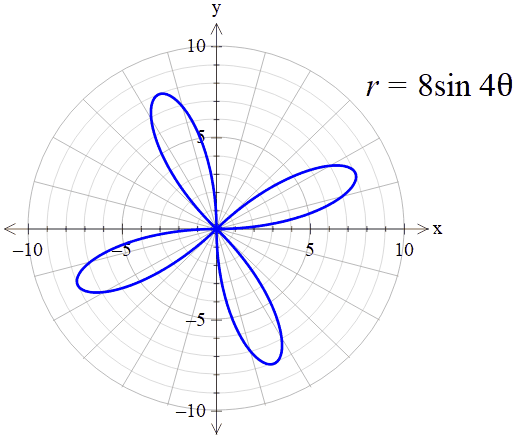
Restriction Off Restriction On