The Quick Entry screen gives you access to most of the capabilities of the graph tool in one location. You can achieve much greater control over the graph tool's output using its other interfaces but you will spend most of your time using this screen.
 F
F
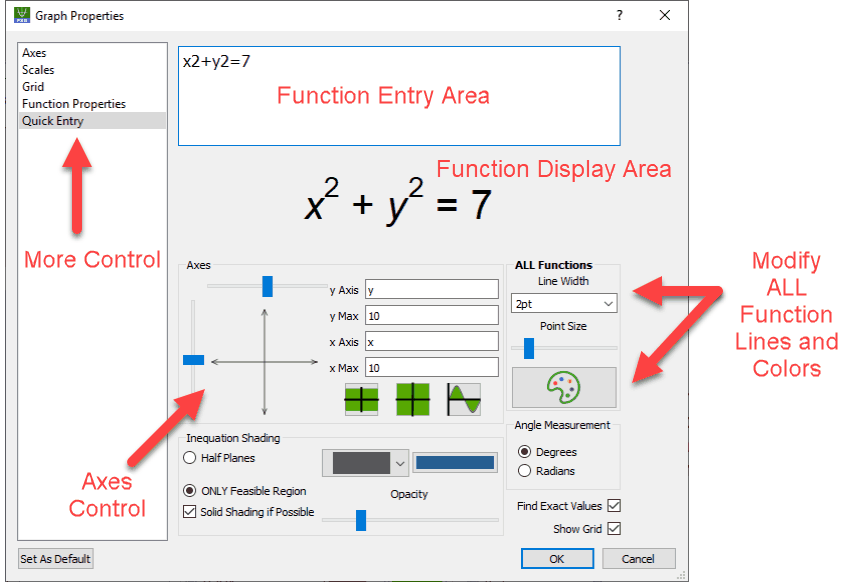
Function Entry Area
Enter your functions - one per line - in this area. the graph tool's function entry utilizes our equation technology which is discussed in more detail later in this manual. You do not need to tell the graph tool what type of function or relationship you are entering, the graph tool will automatically determine this from the structure of the information you enter.
Function Display Area
Displays the currently selected function using our equation technology. Notice how the x2+y2=7 that we typed has been converted to a formatted equation. The Function Display Area allows you to ensure that the graph tool has correctly interpreted what you have typed.
Axis Control
Provides basic, extremely fast, control over the axis settings for the graph tool. Setting the axes using this system is a two stage process.
| 1. | Set the SHAPE you require using the two sliders. |
| 2. | Set the MAXIMUM x and y values. |
The graph tool does everything else automatically (unless you override its automatic selections on the Axes, Scale, Grid and Function Properties pages).
The three buttons allow you to select three default axes types. The first is a free set of axes from -10 to 10. The second is a equal aspect set from -10 to 10 (equal aspect means that x units and y units are the same size). The third button sets y from -1 to 1 and x from 0 to 360 or 2 pi (depending on the angle setting).
Current Function Display Options
Functions and relationships are rendered on screen as lines and points. This section allows you to set the style, weight, colour and size of the lines and points used to display the currently selected function. To change the properties of another function, move the cursor to another function in the Function Entry Area.
More Control
The Axes, Scale, Grid and Function Properties pages give you much greater control over the output of the graph tool. the graph tool will automatically produce great results on most occasions but, inevitably, there will be times when the graph tool's output will not be exactly what you desire. The other pages allow you to achieve what you are after.
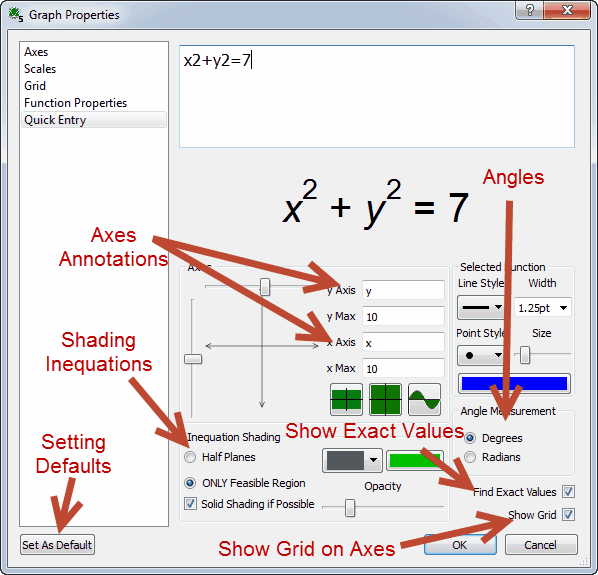
This diagram shows the Quick Entry screen with the More >> button depressed. Notice that we have set the axes to a different shape and set the x Max to 2pi. This forces the graph tool to mark the x scale in fractional parts of pi.
Axis Annotations
By default, the graph tool marks the axes as x and y. You can change these annotations here.
Show Grid
Turns the grid on and off. The grid can also be turned on and off on the Grid page (see More Control)
Feasible Region Options
These settings are discussed in the Inequations & Feasible Regions section of the manual.
Angles
The graph tool can use Degree and Radian angle measurement.
Set As Default
The Quick Entry screen, as with most the graph tool screens, has a Set As Default button. This button makes the graph tool remember your current settings and use them for all future graphs.