
The scattergraph allows you to display and analyse bivariate data.
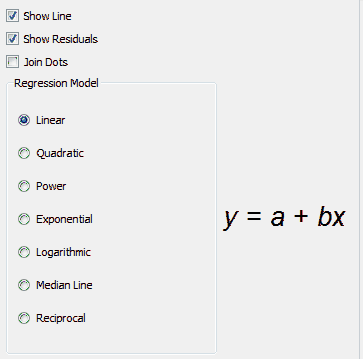
Show Line
Allows you to turn off the regression line - shown as a solid line.
Show Residuals
Allows you to turn off the residuals lines - shown as dotted lines.
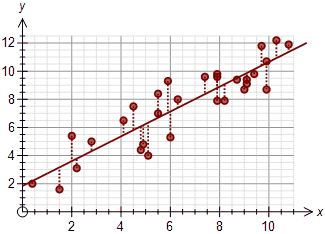
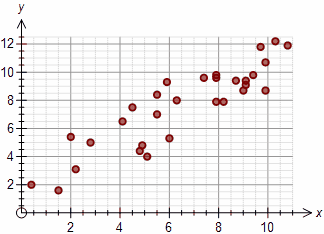
Show Line and Show Residuals ON Show Line and Show Residuals OFF
Join Dots
If you turn this option on, the stat tool will join the dots in the same order as they are listed in the table. This usually just produces a "bird's nest" - especially if the data is unsorted.
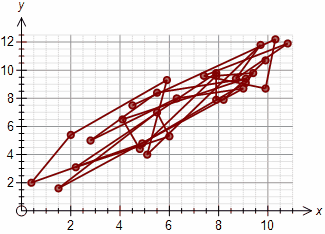
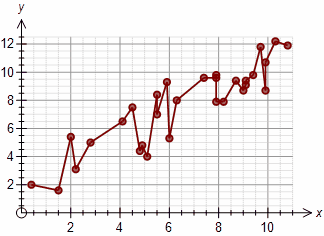
Unsorted Data Sorted by x Values
You can use this feature, providing you enter the points in a logical order, to construct just about any diagram you wish.
Regression Model
The regression model allows you to select which of the seven regression models the stat tool uses to calculate the regression line and residuals.