Statistics, particularly secondary school statistics, is particularly localised. The “right” way of doing something in one location is often very different to the “right” way of doing it in another location. The system options allow you to customise you version of the stat tool to suit you local conditions. System options can be accessed through the Edit menu.
With all the system options it is vital that you TRY each setting and pick the one that suits your situation. Unfortunately there are no standard names for different methods of calculation.
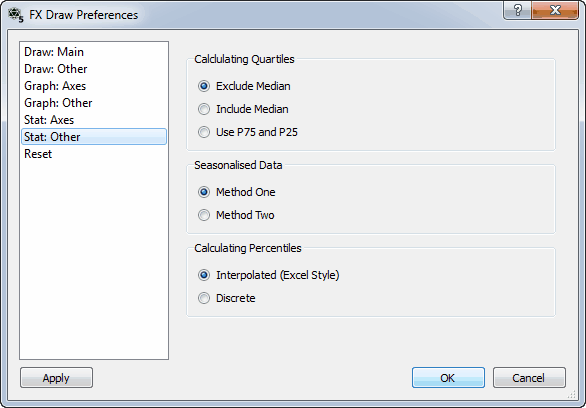
Calculating Quartiles
Efofex has found three common methods of calculating quartiles.
1, 3, 3, 4, 5, 6, 6, 8, 9, 10, 10, 11, 13, 14, 16, 18, 20
In the above example, 9 is the median. The lower quartile is the median of the bottom half of the scores BUT does the lower half include the 9 or exclude it? Depending on your answer, the lower quartile would be 4.5 or 5.
This gives us two of the three options for calculating quartiles. The third is to use the 75th and 25th percentiles. The results of this option depends on how you calculate percentiles.
Seasonalised Data
Method One is to calculate the average residual between a point in the cycle and the moving point average at that point. This average residual is then removed from the data to obtain the seasonalised figure.
Method Two is to calculate the average deviation between a point in the cycle and the mean of the data set. This average deviation is then removed from the data to obtain the seasonalised figure.
Calculating Percentiles
The interpolated method of calculating percentiles is the same as the method in Excel .
If the data point 13 indicates the 20th percentile and data point 14 is the 30th percentile, the 21st percentile is 13.1, the 22nd is 13.2, the 23rd 13.3 and so on. The interpolated method interpolates values for the percentiles that are not in the original data.
The discrete method of calculating percentiles would produce 13 as the value of the percentile for the 20th up to the 29th percentile. Each percentile is guaranteed to be a number in the data set.