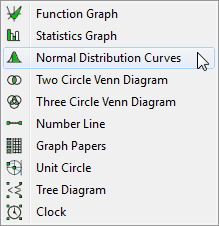
The Normal Distribution Curve tool allows you to draw shaded or unshaded normal distribution curves.

FX Draw - How To Draw Shaded Normal Distribution Curves
If you select the Normal Distribution Curve tool and draw the curve, this will be displayed.
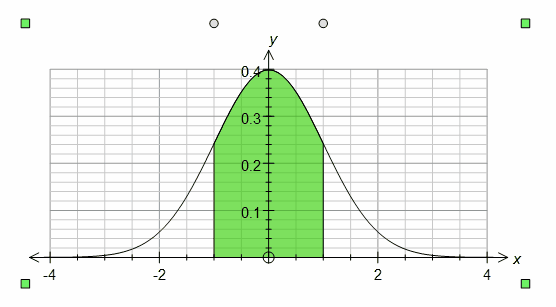
This is a normal distribution curve that has been shaded between z = -1 and z = 1.
When selected, the normal distribution curve will have two sliders. The top slider controls the lower bound of the shading and the bottom slider controls the upper bound.
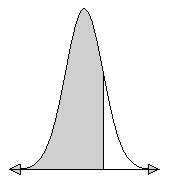
If you wish to produce a diagram where one tail is shaded, merely decrease the lower bound (or increase the upper bound) as far as possible. This will produce the desired result. You will also notice that the shading has changed. This can be achieved using the fill palette.
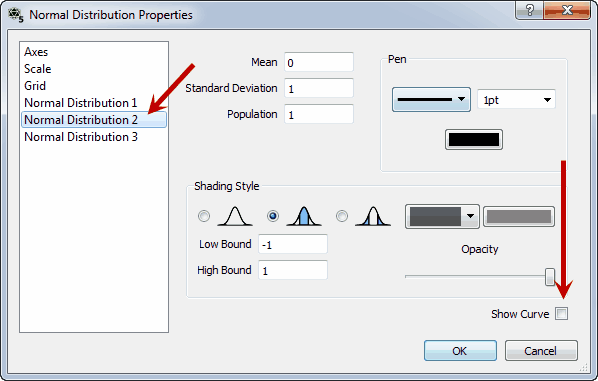
To achieve other shading effects or to set the upper and lower bounds exactly, you will need to right click to edit the properties.
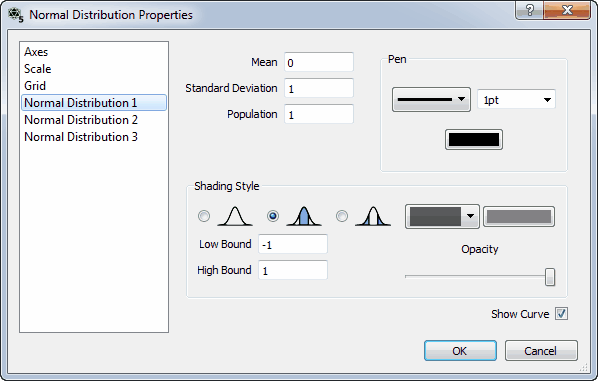
Here you can set the mean, standard deviation and population for the distribution. Note that a population of 1 will produce standard z scores. You can also change the shading style (which allows two tailed shading) and change the pen and shading used. Finally you can explicitly set the high and low bounds for shading.
Notice that the left hand side of the screen allows you change the axes, scales and grid used to graph the normal distribution curve. You can also show two other normal distributions - but you need to ensure that you check Show Curve.
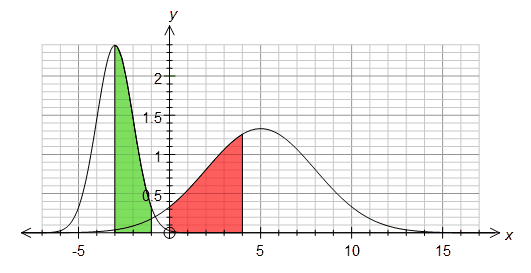
The normal distribution curve tool is not the only way of drawing a normal distribution curve. You can also graph a normal distribution curve by entering y = normal(x) into the function grapher. This allows you to produce much more complicated diagrams.
Available Parameters for Normal Distribution Curves
$below - area (probability) below lower bound
$between - area (probability) between upper and lower bounds
$above - area (probability) above upper bound
$low - lower bound
$high - upper bound