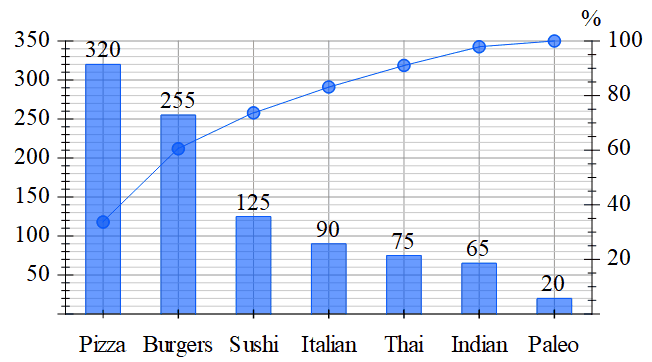
Pareto graphs combine a column graph with a cumulative percentage line.
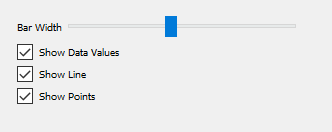
Pareto graphs can only be created for one data set at a time. Options for Pareto graphs include the ability to show the data values and whether to show the line and points of the cumulative percentage line.
Please note that Pareto graphs are normally sorted highest frequency to lowest frequency. The Pareto graph tool does NOT automatically sort the data. This provides greater flexibility for the user.