What are Tables of Values
Tables of Values are data generated from the functions you have entered. One of their main uses is to copy data out of the graph tool and into other products such as Word or Excel.
![]()
Tables Mode
Before using your mouse to create a table of values , you must first enter Tables Mode. Push the ![]() button on the graph tool's toolbar. The cursor will change to remind you that you are using Tables mode.
button on the graph tool's toolbar. The cursor will change to remind you that you are using Tables mode.
Tables mode is available when you have entered a function.
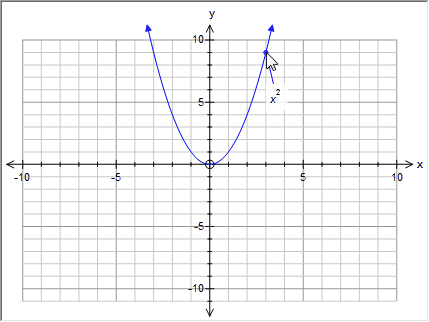
Adding a Table of Values
Easy.
| • | Draw a function. |
| • | Select Table of Values mode |
| • | Hover over a function so that the graph tool finds the function. |
| • | Click |
A table will be inserted using your current defaults.
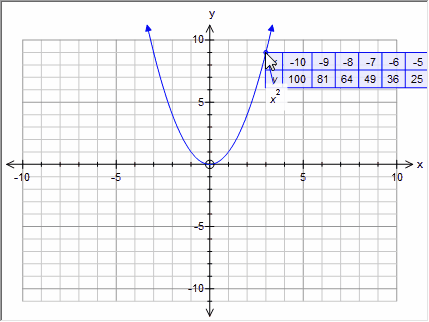
You can then move and modify the table to suit your needs.
Moving a Table of Values?
You can click on a table of values to select it. Once selected, a table can be moved using the mouse.
Horizontal or Vertical?
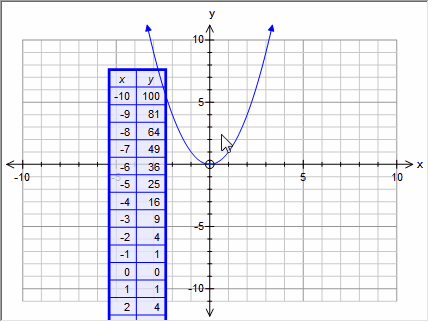
Tables of Values can be horizontal or vertical. The original table of values will be based on your current default. You can change the orientation of the table by right-clicking on it.
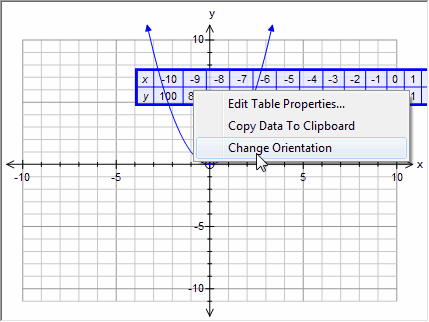
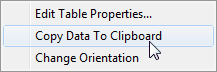
Copying Data to The Clipboard
Data in a table of values can be copied to the clipboard. Right click on a table of values and choose Copy Data to Clipboard. Data will be placed on the clipboard in the same orientation as table of values.
x -10 -9 -8 -7 -6 -5 -4 -3 -2 -1 0 1 2 3 4 5 6 7 8 9 10
y 100 81 64 49 36 25 16 9 4 1 0 1 4 9 16 25 36 49 64 81 100
Table data is placed on the clipboard in formats suitable for insertion into most word processors and spreadsheets.
Where Do The Entries Come From?
When you first insert a table, the graph tool will fill the table with entries automatically. These entries are taken from the current axes settings. If your axes are from -10 to 10 in steps of 1, the table will use the same settings. If your axes are from -pi to pi in steps of pi/8, the table will be the same.
Editing Tables of Values
When you first insert a table, the graph tool will fill the table with entries automatically. These entries are taken from the current axes settings. If your axes are from -10 to 10 in steps of 1, the table will use the same settings. If your axes are from -pi to pi in steps of pi/8, the table will be the same.