The data box properties allow you to control the basic properties of most graph types - how to draw the lines and points; which columns the data box holds; how to fill and how to highlight. It also permits you to combine graph types on one set of axes.
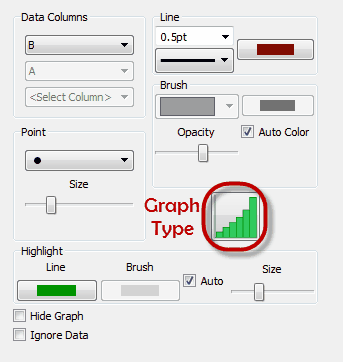
Data Columns
Data columns allow you to select which columns this data box is graphing. You can select columns from the drop down list or use the other approaches listed in Creating A Graph.
Line
Allows you to select the style, thickness and color of any lines used to graph this data set.
Brush
Allows you to select the style, color and opacity of any brushes used to graph this data set. Setting the brush to auto lets the stat tool automatically choose the color of your brush but you can still choose the brushes style and opacity.
Opacity controls how "solid" the color is and how much of the background color is permitted to be seen through the shading. Setting the opacity to zero makes the brush completely transparent. In the example we have drawn the green frequency polygon with three different opacities ranging from almost zero to completely opaque.
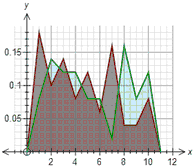
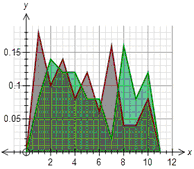
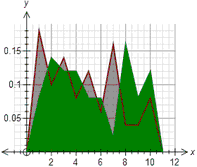
Low Opacity Medium Opacity High Opacity
Point
The point controls allow you to control how any points are shown in the graphs. You can select the point type and size.
Highlight
The stat tool will highlight any cell that is selected or has been manually highlighted. This section allows you to control how any highlighting is shown. You can select the line color used, the brush color used (or allow the stat tool to automatically choose the brush color) and the size of any highlighted points.
Not all graph types use color to highlight data. The Pie graph highlights data by exploding the sector of the pie graph from the other sectors.
Hide Graph
Hide Graph allows you to hide an otherwise fully formatted graph. It can be used to quickly hide and expose graphs for demonstration purposes.
Graph Type Button
The graph type button is used to combine graph types on one set of axes. This is discussed in more detail in Combining Graph Types.