FX Graph

Powerful Graphing - Dead Simple

FX Graph places the power of FX Draw's graphing tool into the hands of students. Very powerful and comprehensive, yet easy to use, FX Graph lets your students use a high productivity tool without you needing to learn a new product.

Graph Anything

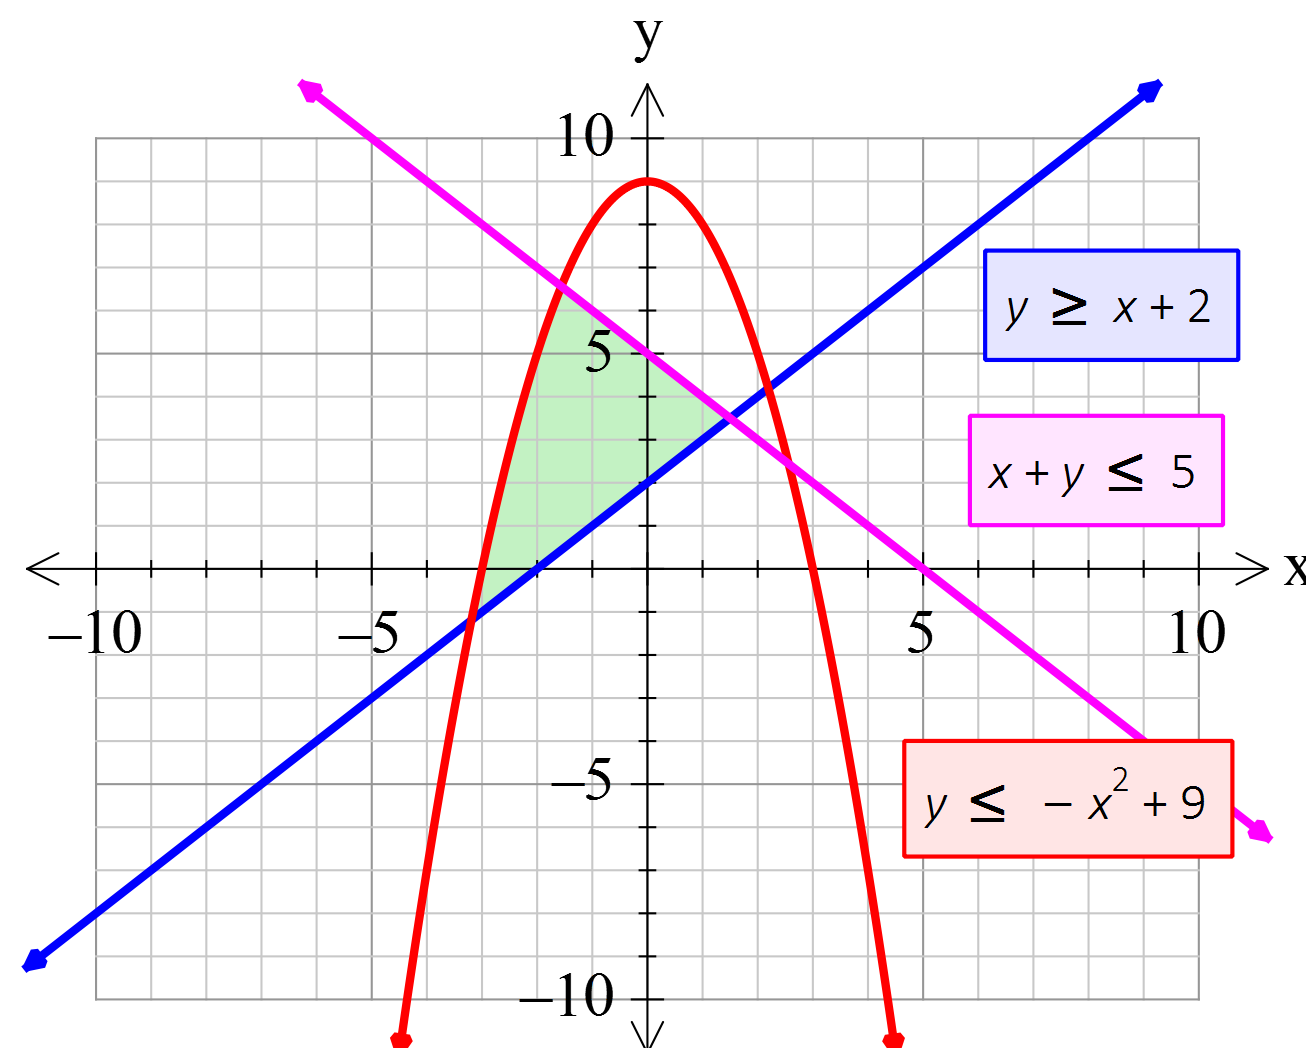
FX Graph is amazingly versatile. It can graph Cartesians, polars, parametrics, slope fields, volumes of rotation, 3D graphs, vector diagrams, linear programming questions and much, much more. Most of the time you just type what you want and FX Graph will sort out how to graph it.

Little Things Matter

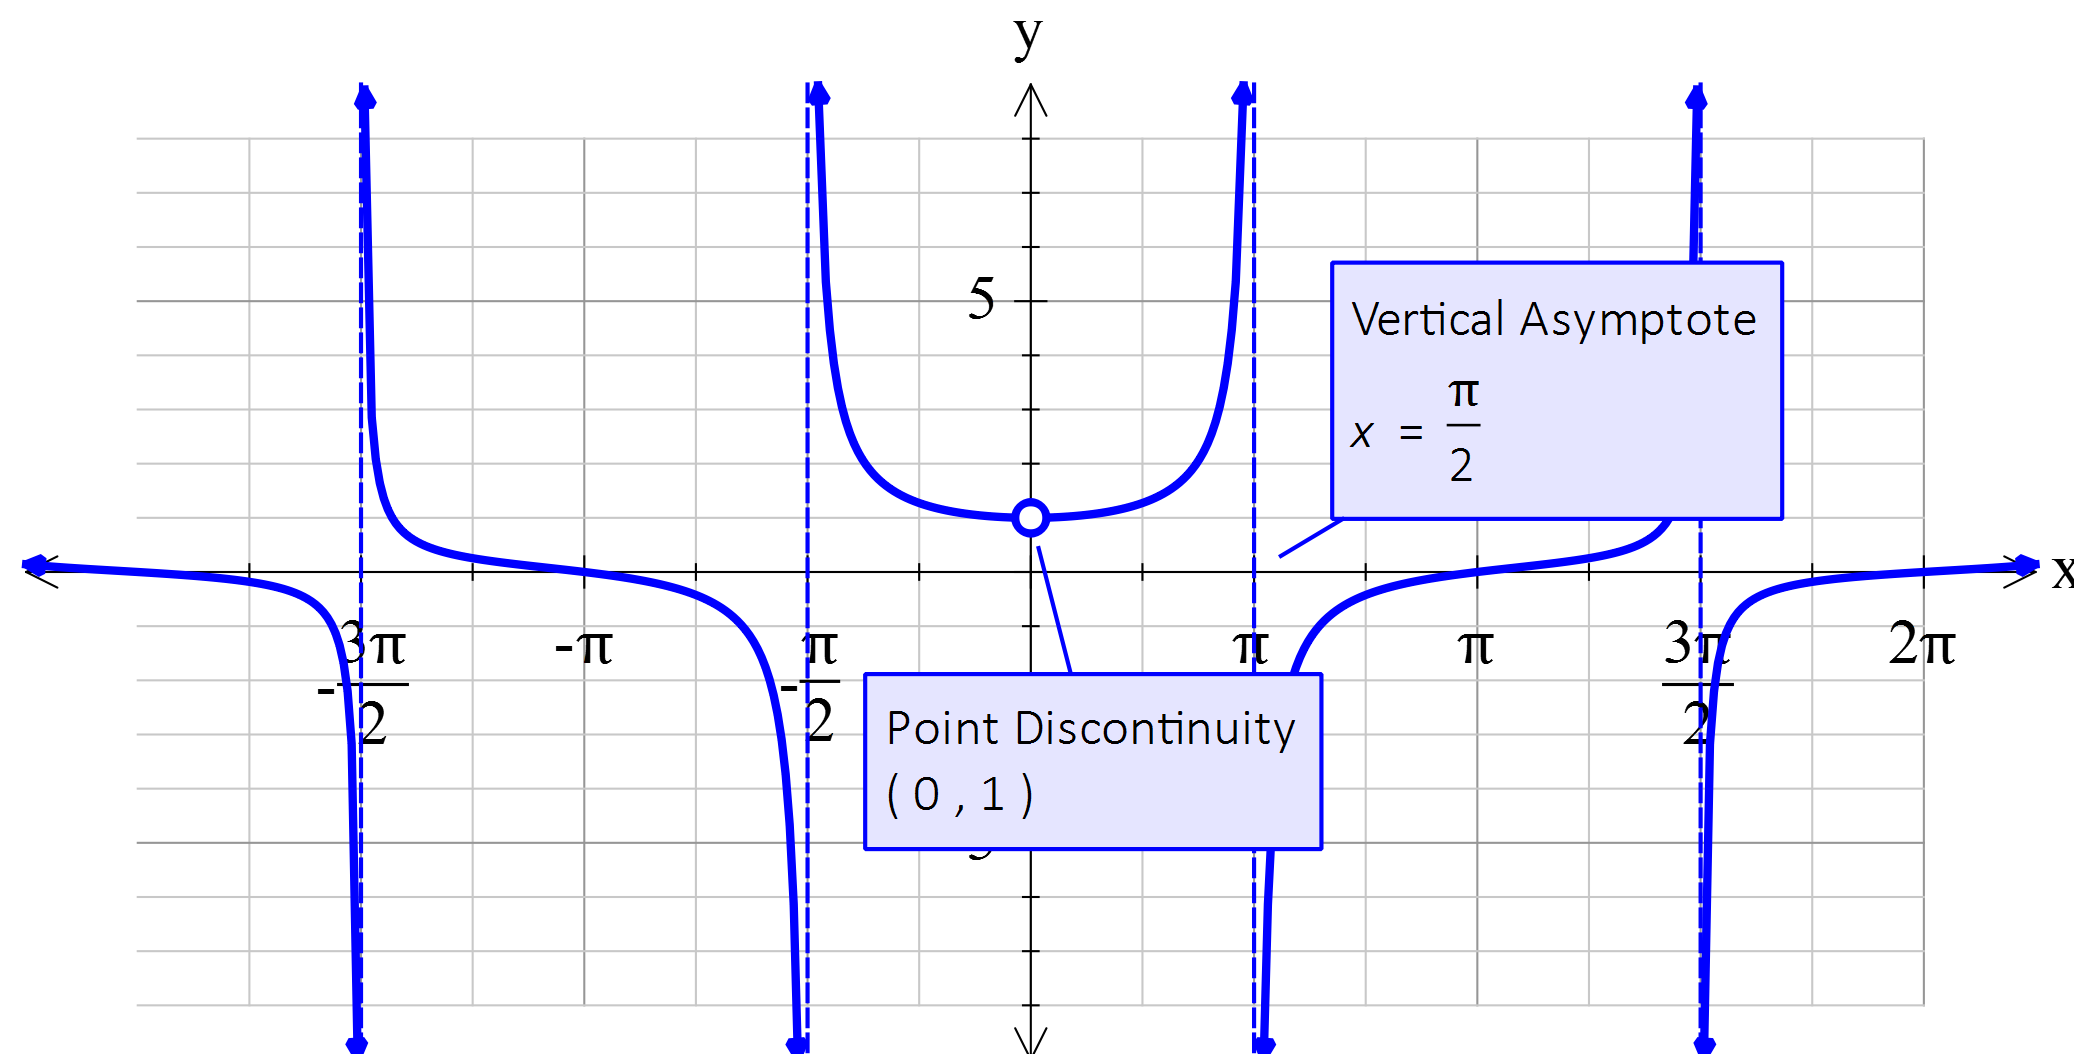
FX Graph understands the things that mathematics teachers need. In this graph of (tan x)/x, it has found the vertical asymptotes, the point discontinuity and marked the x axis in terms of pi. It is these small differences that make FX Graph the most useful graphing tool available.

Almost Unlimited Power

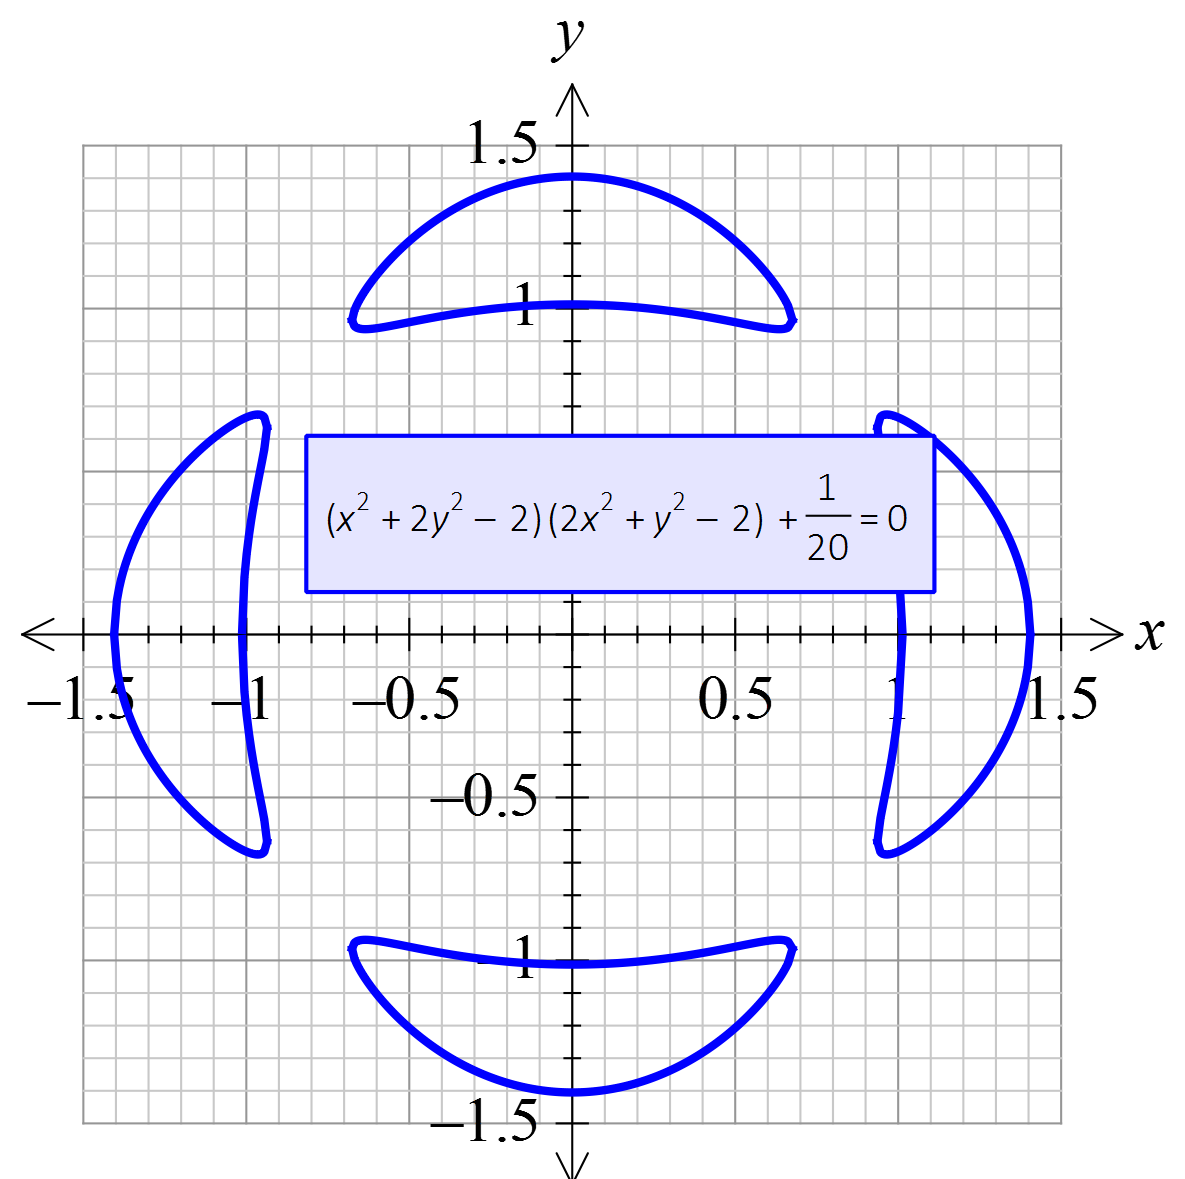
Don't think that just because FX Graph is simple to use it is not powerful. You can just about type anything and FX Graph will draw it for you. Implicitly defined relations are not a problem at all.

3D OK

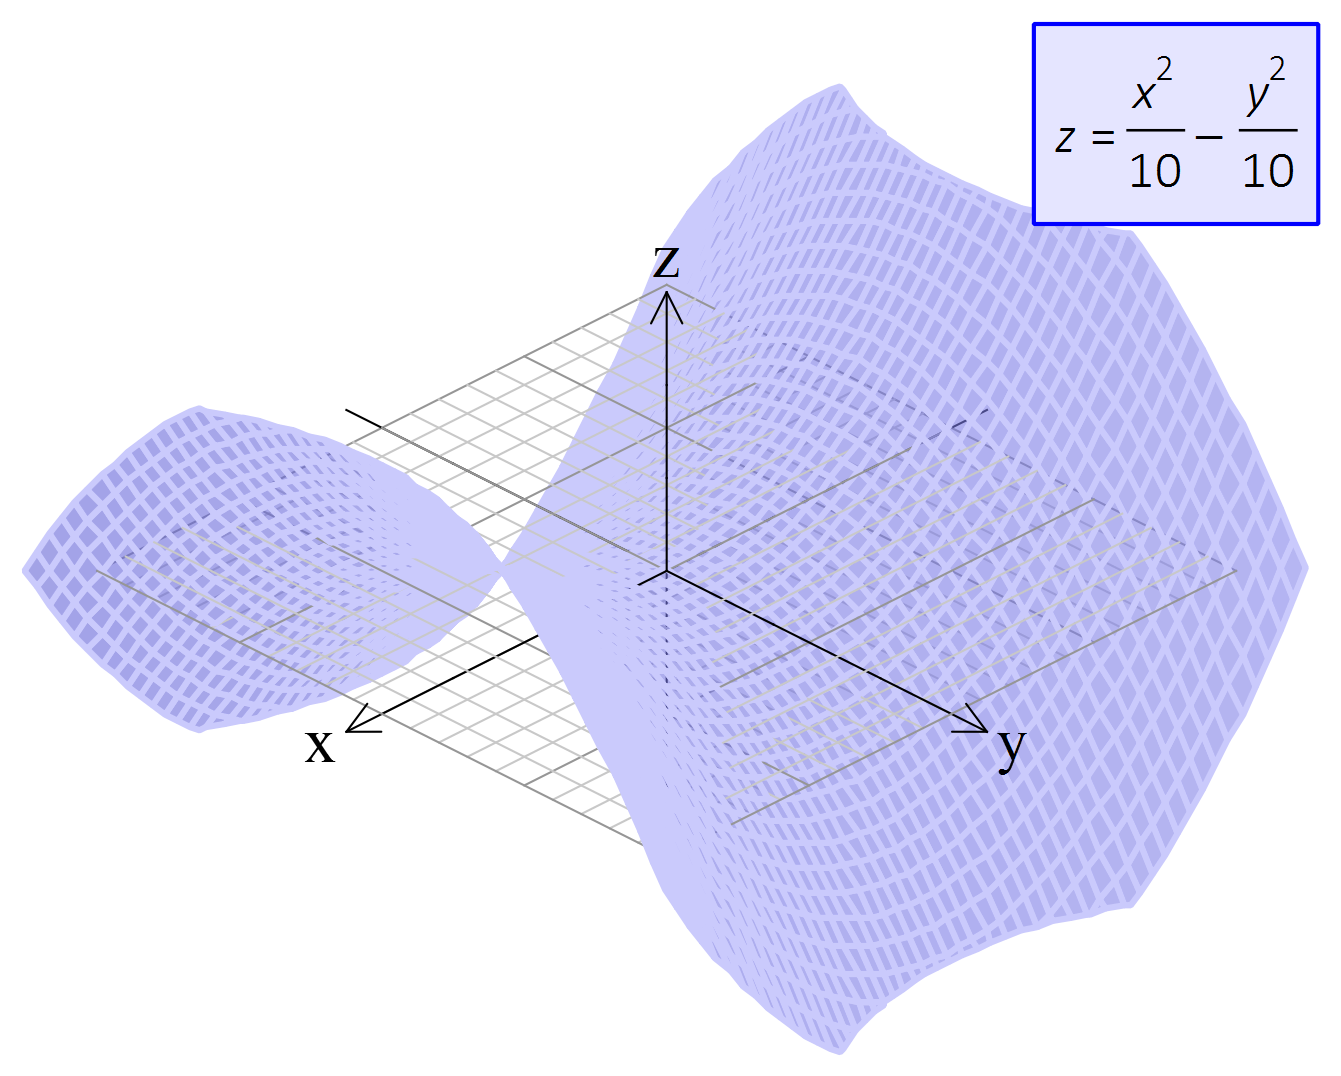
FX Graph lets you draw in three dimensions just as easily as in two. This graph is a "saddle function" but you can also draw three dimensional parametrics and polar functions as well as 3D vectors and volumes of solids of rotation. In fact there is so much power buried in FX Graph, we have devoted a whole video to it.

Trial Versions

These trial versions work in exactly the same way as the registered versions, they just overlay a watermark over all graphics. Logging in to the software with your account details turns them into full versions. Try out all of the features in FX Math Tools.


Take A Look

This short video will show you just what FX Graph can do.

Feature List

Cartesian Functions

  • FX Graph defaults to Cartesian functions. Type any expression involving x (for example 3x3-2x2+2/3) and FX Graph will graph the function.
  • y = is optional for Cartesian functions.
  • Functions can be plotted as points.
  • Function domains can be entered in (-2,4] or -2 < x <= 4 format.
  • Entering domains in {-2,4} format draws the graph with the restricted domain but places arrow heads on the ends of the curve.
  • Points of interest are automatically calculated and displayed when the mouse pointer hovers over the point.
  • Points of interest can be calculated as exact values.
  • First and second derivative curves.
  • Curves graphed with out of range arrows if required.
  • Vertical asymptotes calculated and drawn.
  • Horizontal asymptotes.
  • Oblique asymptotes.
  • Tangent lines can be added to function curve.
  • Secant lines can be added to function curve.
  • Tables of values can be calculated for function and added to graphic.
  • Points can be marked on function and coordinates of the points shown.
  • Integrals can be added.
  • Cartesian functions can be typed in any order. No need to convert to y = format.

Inverse Functions

  • Functions entered as x = f(y) will be graphed as inverse functions. Entered domains are interpreted as applying to y.

Implicitly Defined Functions

  • Any (valid) combination of x and y can be graphed.
  • FX Graph will attempt to internally rearrange the function to y =, then x =, in order to provide more advanced analysis.
  • Conics.

Polar Functions

  • Any function entered as r = f(th) can be graphed. FX Graph uses th to represent theta
  • Inverse polar functions (eg th = sin r) are supported (and are often very interesting).
  • Degrees and radians supported.

Parametric Equations

  • Enter functions as x=f(t);y=f(t) .
  • Domains can be entered in (-2,4] or -2 < t <= 4 format.
  • You can show the direction of the parameter on the curve.

Inequations

  • FX Graph can interpret and use >, >=, < and <=.
  • Graph either side of inequation depending on local preference.
  • Shading color-coded to inequation.
  • Inequations do not need to be rearranged to y >= format.
  • Inequations can be calculated for Cartesian, inverse, implicitly defined and polar functions.
  • Feasible Regions. FX Graph can calculate and show JUST the feasible region for a system of inequations

Constants, Variables and Animations

  • a, b, c, d and m are used as constants.
  • Constants and variables can be changed using controllers.
  • Animate graphics using constants and variables.
  • Generate families of curves based on a changing constant.
  • Dynamically show drawing of curve using variable controllers.
  • Constants can be used throughout FX Graph. Domains, bounds of integration, tangent points, number of divisions for integral approximations can all be animated using constants.

Integrals

  • Draw integrals using mouse.
  • Integrals to x-axis, y-axis and integrals between curves.
  • Calculate areas and integrals automatically.
  • Calculate integral approximations using trapeziums, minima, maxima, midpoint, left, right and Simpson's rule.
  • Integrals can be rotated to create Volumes of Revolution.

Arc/Curve Lengths and Ruler

  • The arc length tool operates in an almost identical way to the integral tool but calculates the arc/curve length of the function.
  • The ruler tool allows you to measure linear distances on the axes.

Axes and Grids

  • Annotate axes in degrees and fractional multiples of pi.
  • Quickly set axes and scales using the shape of the axes and maxima. Other settings set automatically.
  • Full manual control over axes if required.
  • Ability to show broken axes.
  • Log and log/log axes.
  • Cartesian grids and dots.
  • Polar grids and dots.

Points and Vectors

  • Plot points eg (1,2).
  • Join plotted points eg (1,2)+(3,5).
  • Draw vectors eg <1,4>.
  • Add vectors eg <3,4>+<-2,3>.
  • Vectors from points eg (1,2)+<2,3>.
  • Can use constants in vectors to create vector equation of lines eg (1,2)+a<1,4>.

Complex Numbers

  • Plot points on complex plane eg z=2+2i or z = 4cis pi/2.
  • Plot solutions to equations such as z^5=64.
  • Use magnitude of complex numbers eg |z| > 4.

Slope Fields

  • Use y' to create slope fields.
  • Plot points on a slope field to solve differential equations.

3D Graphing

  • 3D Cartesian graphs are entered as z = x2/10-4sin y (for example).
  • Enter 3D polar functions using th for theta and ph for phi. For example: r=5sin 2th+5cos 3ph
  • Enter 3D vectors and points. Use similar notation to 2D Points and Vectors. For example (1,2,3)+ <4,3,2>
  • Enter 3D parametric functions in terms of t. For example: x = 5 cos t; y = 5 sin t; z = 5 cos 3t

Volumes of Solids of Revolution

  • Right click on any integral to rotate it around the x or y axis. See the result in 3D.
  • The volume controller lets you dynamically demonstrate the rotation.

Annotations

  • Annotations automatically generated from functions.
  • Annotations can be added to graph using one click.
  • Annotations are automatically updated during animations.
  • Annotations can be fully customised.

Output Options

  • High resolution bitmaps, PNG, TIF and JPG files.
  • Vector based SVG files.
  • Insertable OLE object.

Integration and Compatibility

  • One file type compatible across all platforms.
  • Connection based system which allows integration with any product.
  • Insertable OLE object.
  • Integration with Word 2007 (and later) ribbon bar.
  • Integration with Powerpoint 2010 (and later) ribbon bar.
  • Output suitable for Pages and Keynote.',FALSE,TRUE);
  • Create FX Graph file from multiple inserted OLE objects in a Word file.

Subscribe to Newsletter

Keep up to date with changes by subscribing.

Subscribe to Efofex Insider

Technical information for Efofex gurus.