FX Stat

Statistical Graphing Your Way

FX Stat focuses on providing a statistics tool designed specifically for secondary level mathematics, that produces the graphs you need, drawn exactly the way you need them. We are committed to getting FX Stat to draw the many variations of graphs required by different school systems.

Designed For Secondary Schools

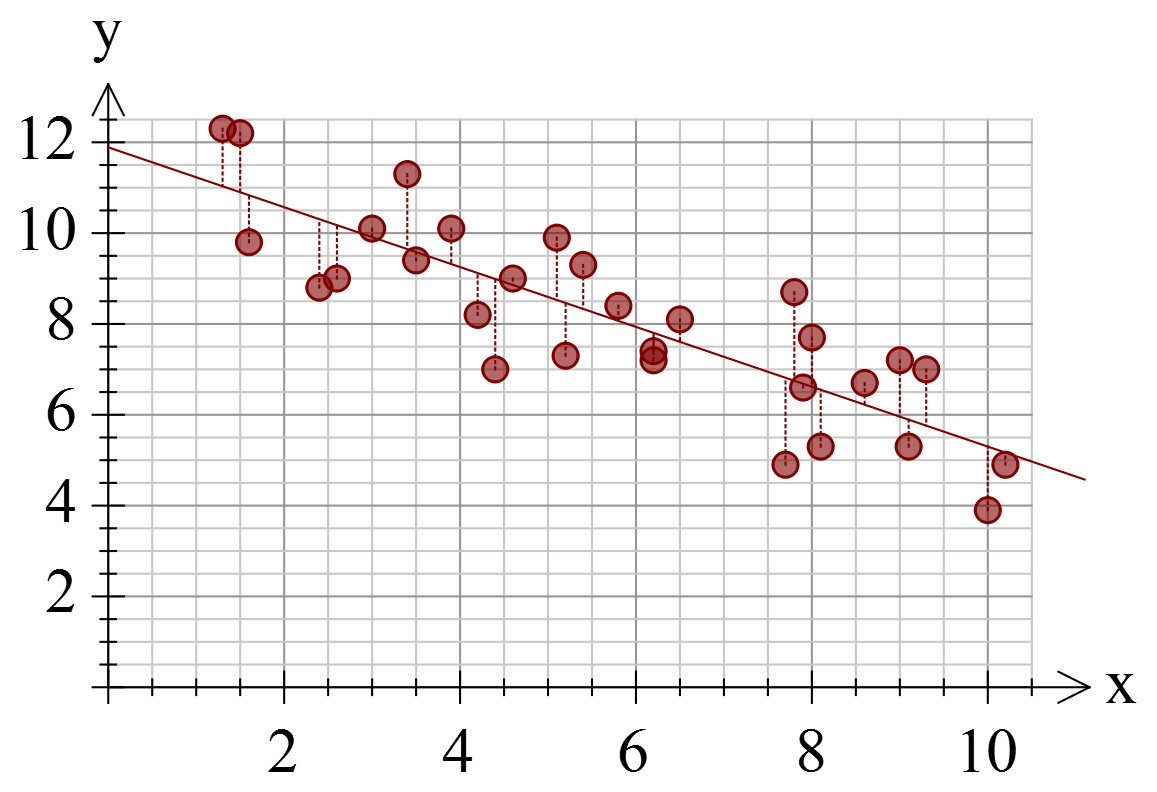
Many statistics packages are designed with universities/colleges in mind. They provide every conceivable option and lots of tools that are useless for secondary school teachers. FX Stat takes a different approach, providing just the tools that secondary teachers need, exactly the way they need them. For example, we provide sixteen data generators that can create data that fits your needs. You want some bivariate data with a correlation coefficient of about -0.85? Done!

Verstatile

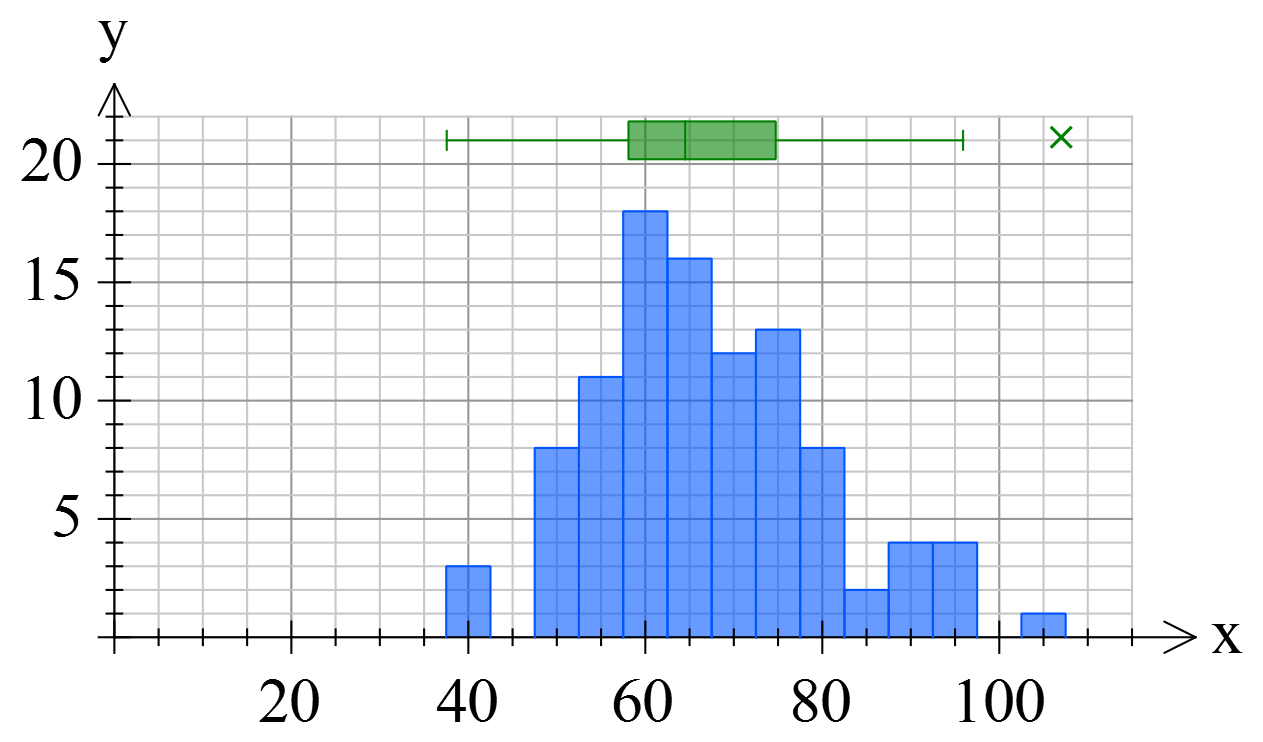
Mathematics teachers need a variety of quite unusual graphs to help them teach and FX Stat has been designed by teachers just like you. In this example we have mixed a histogram with a box and whisker plot to show the relationship between the two graphs for the same data.

And LOTS More

What we cannot show you here is the power of the underlying statistical tool. Things like the numerous data generators that can save you hours; the automatically calculated comprehensive summary statistics; the ability to dynamically modify your data and see the result on screen; the powerful selection of statistical tools built right in. Most importantly, we cannot show you our commitment to ensuring that the tool produces exactly the types of graphs you need. If a graph is not quite "right", tell us about it and we can normally get it showing things your way.

Trial Versions

These trial versions work in exactly the same way as the registered versions, they just overlay a watermark over all graphics. Logging in to the software with your account details turns them into full versions. Try out all of the features in FX Math Tools.


Take A Look

This short video will show you just what FX Stat can do.


Feature List

Univariate Graph Types

  • Bar graphs.
  • Stacked bar graphs.
  • Column graphs.
  • Stacked column graphs.
  • Pie graphs.
  • Horizontal box and whisker graphs with or without outliers.
  • Vertical box and whisker graphs with or without outliers.
  • Cumulative frequency graph.
  • Dot plot.
  • One-sided stem and leaf diagram.
  • Two-sided stem and leaf diagram.
  • Line graphs.
  • Moving point average line graph overlays.
  • Seasonalized (deseasonalized) line graph overlays.
  • Regression model line graph overlays.
  • Frequency polygons.
  • Stacked frequency polygons.
  • Histograms.
  • Stacked histograms.
  • Cumulative histograms.
  • Stacked cumulative histograms.
  • Two-sided histograms.
  • Divided bar graphs.

Bivariate Graph Types

  • Scattergraphs.
  • Scattergraphs can overlay regression models and residuals.
  • Residual graphs.
  • Horizontal link graphs.
  • Vertical link graphs.

Trivariate Graph Types

  • Triangle graphs.

Data

  • Data entered in columns. Up to 10000 data points per set.
  • Grouped data frequency tables supported.
  • Frequency tables supported.
  • Mask and highlight data on graph.
  • Up to twenty four data sets can be included on one graph.
  • Intelligent fill-down. Particularly useful for groups.
  • Data type auto-detection.
  • Data can be copied to clipboard as columns or rows.

Summary Statistics and Data Analysis

  • FX Stat automatically produces comprehensive summary statistics for univariate and bivariate data.
  • Mean, sample standard deviation and population standard deviation.
  • Variance.
  • Minimum, maximum values and range.
  • Median, upper quartile, lower quartile and inter-quartile range.
  • Mode.
  • Geometric mean.
  • Mean absolute deviation.
  • Sum and sum of squares.
  • Deciles.
  • Stanines.
  • Percentiles.
  • Correlation coefficient.
  • Linear, Quadratic, Power, Exponential, Logarithmic, Median Line and Reciprocal regression models.
  • Equation of curve of best fit for each regression model.
  • Covariance.
  • Sum of products.

Data Generators

  • FX Stat provides a comprehensive set of data generators that can generate data based on multiple probability density functions.
  • Equi-Likely integers.
  • Bernoulli distribution.
  • Binomial distribution.
  • Hypergeometric distribution.
  • Geometric distribution.
  • Negative binomial distribution.
  • Poisson distribution.
  • Normal distribution.
  • Uniform continuous distribution.
  • Exponential distribution.
  • Log normal distribution.
  • Chi-squared distribution.
  • Bivariate data generator for given regression model and correlation coefficient.
  • Time series data generator for multiple cycle lengths and underlying regression model.
  • Dice simulator.

Data Manipulation

  • Data transformations based on a formula.
  • Data grouping commands.
  • Fibonacci and tribonaccie commands.
  • Frequency table creation command.
  • Normal distribution probabilities.
  • z Score calculation.
  • Stanine, decile and percentile calculation.
  • Prediction (x hat and y hat) based on regression model.
  • Ranking scores.
  • x and y residuals based on regression model.
  • Rounding command.
  • Sorting data.
  • Standardise data to a new mean and standard deviation.
  • Calculate triangular numbers.

Output Options

  • High resolution bitmaps, PNG, TIF and JPG files.
  • Vector based SVG files.
  • Insertable OLE object.
  • Copy and paste data to and from other spreadsheets.

Integration and Compatibility

  • One file type compatible across all platforms.
  • Connection based system which allows integration with any product.
  • Insertable OLE object.
  • Integration with Word 2007 (and later) ribbon bar.
  • Integration with Powerpoint 2010 (and later) ribbon bar.
  • Output suitable for Pages and Keynote.
  • Create FX Stat file from multiple inserted OLE objects in a Word file.

Subscribe to Newsletter

Keep up to date with changes by subscribing.

Subscribe to Efofex Insider

Technical information for Efofex gurus.